Remove data siloes and tribal knowledge make information and
insights accessible to all with Wiz
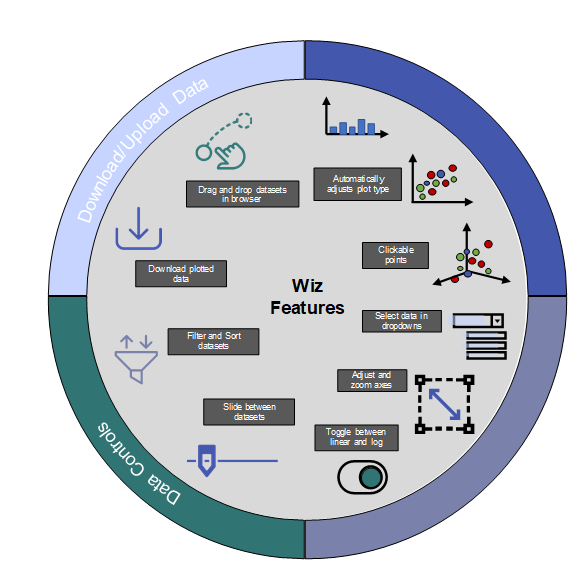
Our platform makes data from manufacturing processes and other disparate
systems more accessible with a simple drag and drop interface and intuitive
workflows, data can be explored up to 5 dimensions. Wiz can also be used to
perform real-time monitoring and advanced analysis from a web browser.
Context
In the age of big data, understanding and visualizing data is as important as
its collection. Dr. Peyman Z. Moghadam’s team at the University of Sheffield
has developed Wiz, an interactive big-data visualization tool built in Python.
Wiz allows users to explore data beyond static images, providing interactive
analysis of datasets up to 5 dimensions (5D). The web-based app combines the
accessibility of web applications with robust real-time data analysis
capabilities, making it invaluable for industries embracing digitalization,
IoT, and AI.
Deep integration with zero configuration
You only need a browser and a problem.
through a low-code, intuitive UI interfaces.
Embracing the industry 4.0 paradigm, our solution allows frontline workers to
develop dashboards and other digital tools through a low-code, intuitive UI
interfaces. Wiz turns data into actionable insights, driving business growth
across industries over the next 10-20 years. As a one-stop shop for real-time
data analysis and visualization, Wiz is accessible to scientists and
non-scientists alike, requiring no coding or software downloads—just a dataset
and a browser. This democratizes data analysis, enabling better understanding
and utilization of big data to unlock its full potential.
Don’t pay to train personnel use new software, buy new software that can teach
your employees how to digitise their workflow. Our solution enables the
integration of disparate models, machines and data siloes, thereby bringing a
unified architecture. We guide you through your digital literacy journey and
streamline your productivity